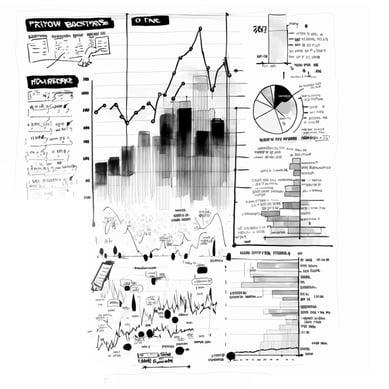
Yet, many Walmart suppliers face challenges when they rely solely on raw data and Excel for their analytics and reporting.
This approach often creates more problems than insights, leading to a lack of commitment to analytics and an inability to grow their business.
Let's explore a hypothetical brand's story, which mirrors the experiences of many vendors and their analytics processes.
Story time: Illustrating the Challenges of Excel-Based Retail Analytics
Warning: The following may be disturbing to some readers.
Meet Jill
By her count (and she is counting), Jill has been with the company for 6 years, 3 months, 14 days, 7 hours, and 26 minutes.
Her company, a Walmart vendor, recognizes the value of data and analytics, and “they’re planning” to make more strategic investments in their analytics program.
 But right now Jill is the company’s analytics program. She’s the only one who knows Retail Link. Heck, she’s the only one with access to the data. And Jill’s also the only one who knows how to update weekly sales and inventory reports, which the company uses to understand recent performance of their SKUs across Walmart stores.
It’s her job to keep her team in-the-know about sales and inventory activity at Walmart.
Excel or Die
Every Monday morning, Jill logs on to Retail Link, downloads CSVs, runs pivot tables, updates charts, and assembles a summary brief, which is then distributed across the company.
It’s lots of manual work, which she starts on Sunday night.
The company has been using Excel for years. It’s familiar; it’s recognizable; it’s “more than adequate.” And, there’s no real urgency to move away from Excel. Something about, “If it ain’t broken…”
Bye Bye, Jill
One day...Jill leaves the company. There was a cake and a lot of cards. But there was very little training – as in, training her replacement.
Besides, as the company managers told themselves as well as one another, “This is actually good news. We’ve been wanting to upgrade our analytics program for a long time, haven’t we? We know we have to. This is finally our chance. Finally.”
Except, they need to make it through “the next few crucial weeks” before they can set their minds to a redesign of their analytics program. “But we’re going to do it. We have to do it.”
For now, though, Larry from sales will fill the void left by Jill.
Before leaving, Jill shared the log-in information and Excel files with Larry, so the company feels good about holding the course until they can invest more in elevating their analytics program.
The First Crazy Weekend
A longtime salesperson, Larry knows how it works:
-
Eighty-percent of the brand’s weekly sales will come in over the weekend.
-
Team members will enjoy their free time on Saturday and Sunday, although their thoughts will drift: “I sure hope sales are strong this weekend.”
-
Everyone will return to the office Monday morning chomping at the bit to know how sales did over the weekend. And needing to know where to focus their efforts.
And in the wake of Jill’s departure, it’ll be for Larry to tell everyone the score.
So, he kisses off family time on Sunday to bone up on Retail Link and Excel. “I wish I would have asked Jill more questions,” he thinks to himself. “This all looks foreign to me.”
Larry can tell that sales are looking flat for the weekend, though everyone – including the retailer – was expecting a nice sales bump Friday-Sunday.
It becomes clear to Larry: “Everyone’s going to pelt me with questions tomorrow, and I’m new to this.”
But Larry forges ahead, assembling pivot tables and charts, and summarizing the past week’s sales activity.
Late Sunday night, exhausted from the day, Larry plants a kiss on his kids’ foreheads as they sleep, then slumps into bed himself.
That First Manic Monday
The response to Larry’s email, reporting the weekend’s disappointing numbers, creates even more anxiety than he anticipated.
All morning, folks across sales, supply chain, category, even top management have been emailing questions. And while those questions vary, they all have one word in common: “Why?”
As in, “Why are the numbers this far off of forecast?”
But it’s a conversation with a sales director that has Larry feeling the most pressure, as he scurries to run more pivot tables, update more charts, and run more reports to uncover root causes of the brand’s lackluster weekend.

The sales director just had an unsettling conversation with the category buyer at Walmart. “It seems,” the sales director says, “that the category at-large saw a slight but underwhelming bump. The buyer says our SKUs were the real laggards, and she wants to know…”
“Why?,” Larry finished the sales director’s sentence.
The sales team needs Larry, and his data access, to put out the fire and reassure the buyer.
“What a Monday,” Larry thinks to himself.
Three Months Later…
…and still company management is in firefighting mode, and Larry’s starting to wonder if what was supposed to be a holding pattern has become the new status quo. Is he the new “Jill”?
He was hoping that one tough weekend would be no more than a flash-in-the-pan, and, in some ways, it was. In other ways, it wasn’t.
Sure, sales did move toward forecasts, but lingering questions about the brand’s long-term prospects remain top of mind – for the company and its skeptical buyer.
More than that, Larry feels like he can’t catch a break. With every new weekend and every new manic Monday, he’s inundated with questions from team members far and wide. If it’s not one thing, it’s another:
-
What caused this sales lag? What caused this sales bump?
-
Why weren’t we OTIF at these stores?
-
Where’s the new product selling best? Worst?
-
How’s inventory holding up in this region?
-
Where’s the optimal placement for this SKU?
But, Larry’s noticed, it’s been the fees getting a lot of attention. And causing most of his headaches.
Clawback After Clawback
Fees for late delivery. Fees for out of stocks. Fees for misplaced labels. Fees for…you get the point.
They’re starting to undermine profits, and everyone is seeking answers from Larry – about sales, stock levels, deliveries, and the like.
For his part, Larry feels ill-equipped to find answers, especially the kinds of answers that would help his company contest the steep penalties and claw back some of those clawbacks.
It’s Raining Data

To exacerbate matters for Larry, new datasets and new data sources keep emerging.
“How to incorporate these diverse data sources into my reports,” Larry wonders.
Larry – and his bosses – see the value of incorporating more data from more sources, but their current analytics platform isn’t flexible.
More data means more manual input, and who has time?
“What’s Going On, Larry?”
Somewhere in this series of kerfuffles, Larry’s “honeymoon” ended. His boss feels he’s been in his role long enough to be more resourceful – with quicker answers, insights, and perspectives.
Retail conditions, retail partners, competitor moves, and organizational dynamics are all exerting more pressure on Larry to do more with “his” retail analytics solution.
Which still, despite big intentions, is Excel and Retail Link.
Losing Faith
Unable to break away from the analytics culture of the past, many on the team are even starting to lose faith in data’s ability to move their company forward at all.
Larry’s at the front of the line with such doubts.

The Moral(s) of this Analytics Story
Maybe the story hasn’t played out exactly like that for your brand.
But most Walmart suppliers have wrangled with one or more of these Everyday Little Problems (EDLPs) for their retail analytics program:
-
A disproportionate amount of knowledge and access (e.g., about Retail Link) resting with one or two employees
-
Big intentions about analytics but little real action
-
Reliance on Excel, pivot tables, and time-consuming manual processes
-
Crazy weekends and manic Mondays
-
Tons of unanswered “why?” questions, from both team members and retail partners
-
Inability to combat fees incurred from Walmart
-
Data overload and how to incorporate new datasets and data sources
-
Wavering faith and confidence in data, analytics, and the often under-resourced employees doing their best
Instead of pushing through these problems and advancing their analytics program, too many Walmart suppliers settle for good enough or, even, retreat.
But the solution to these problems is often a matter of going bigger – not smaller – on retail data and analytics. A half-hearted commitment to analytics often creates as many problems as it does insights.
Often, it’s a matter of simply finding (and using) better retail analytics tools.
For Walmart suppliers there simply can’t be any looking back. There is a strong need, now more than ever, for a flexible solution to bring in data and gain insights.
There are too many benefits that come with an advanced retail analytics software such as Retail Analytics.

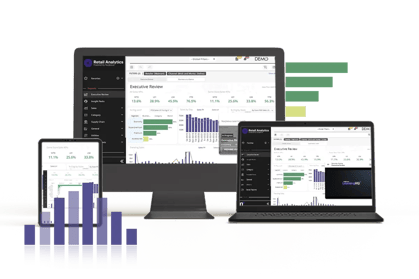
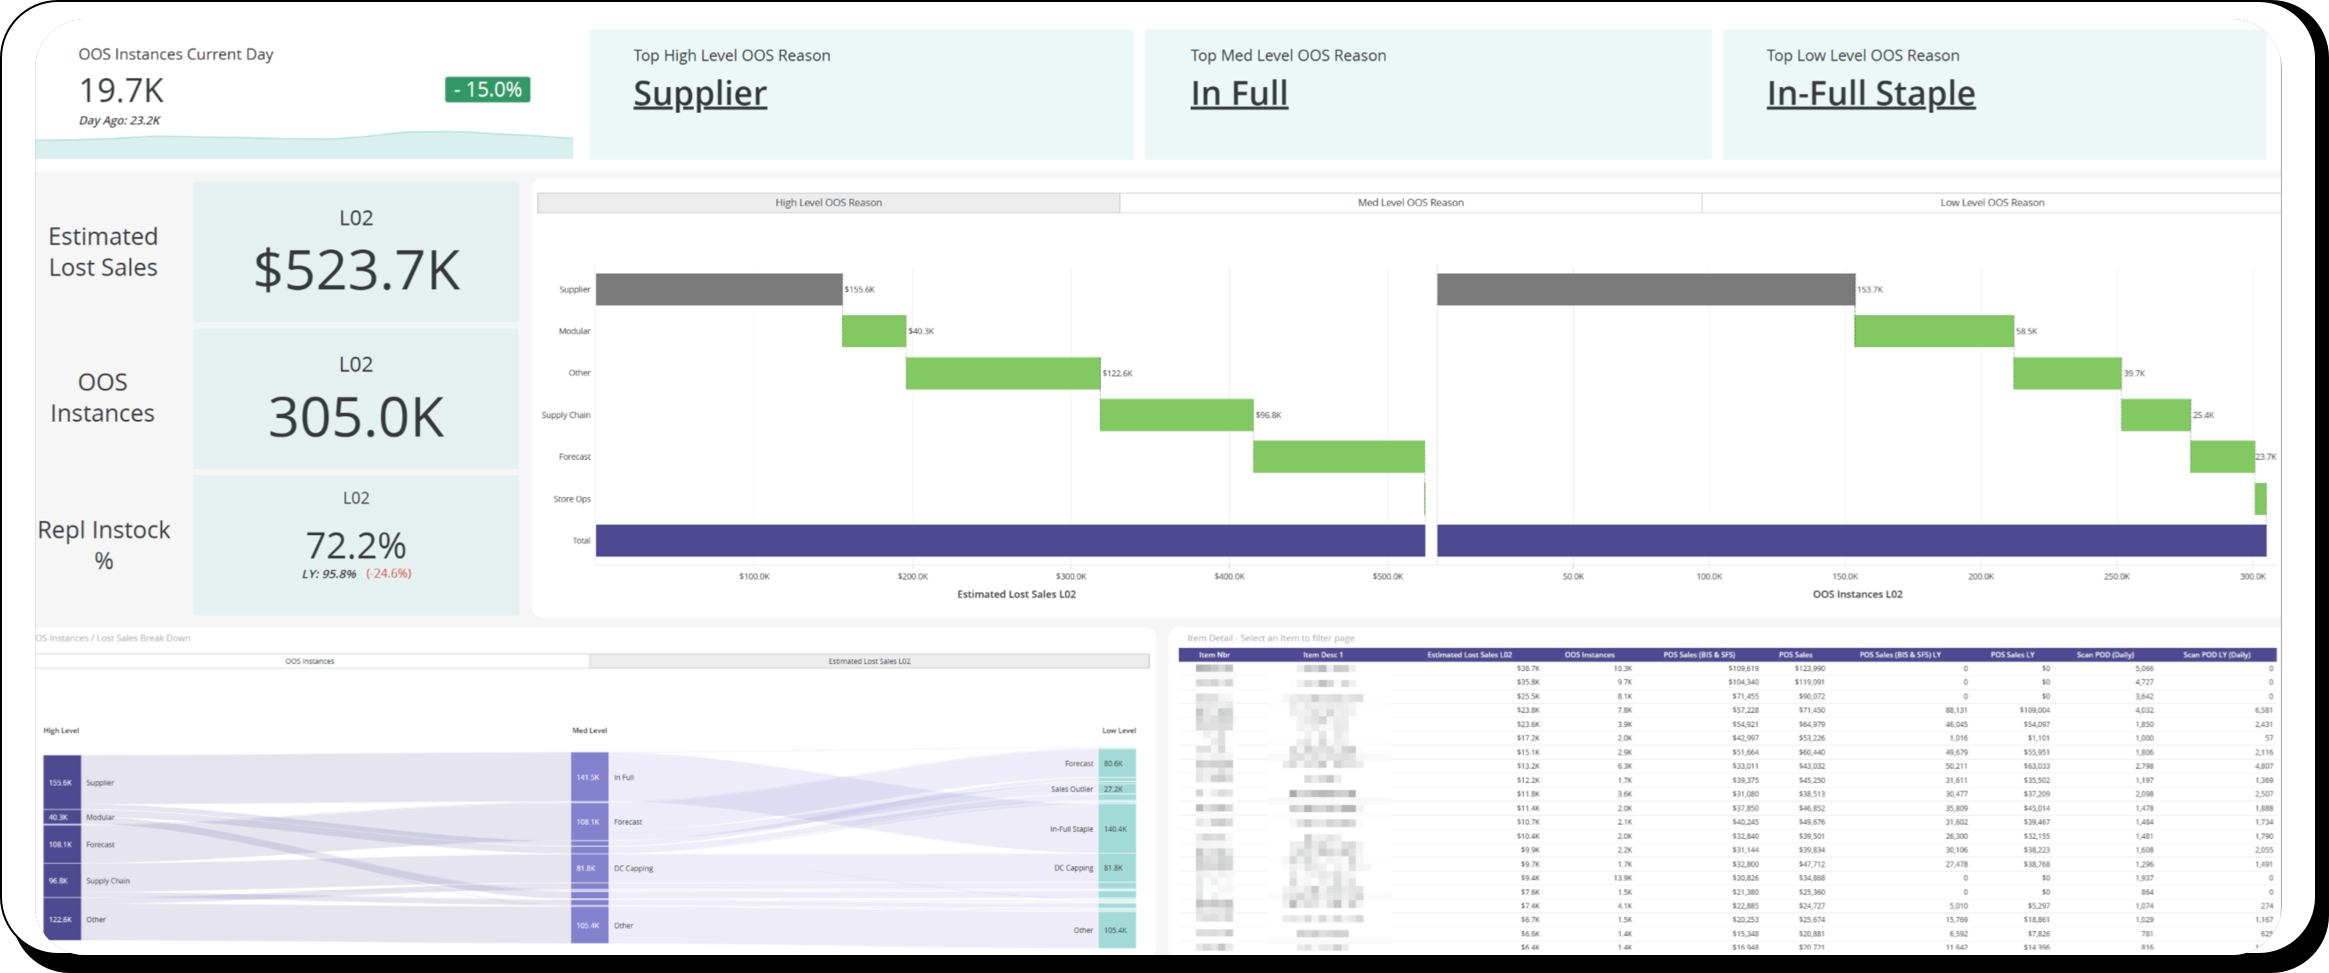
Retail Analytics Software can help Walmart suppliers overcome challenges of limited knowledge and access, lack of action, reliance on manual processes, unanswered questions, combating fees, and data overload. By utilizing Nuqleous Retail Analytics, suppliers can efficiently analyze business performance, take action and become top-tier suppliers.
Interested? Ready to explore the possibilities? Let's talk.

 But right now Jill is the company’s analytics program. She’s the only one who knows Retail Link. Heck, she’s the only one with access to the data. And Jill’s also the only one who knows how to update weekly sales and inventory reports, which the company uses to understand recent performance of their SKUs across Walmart stores.


.webp)
